


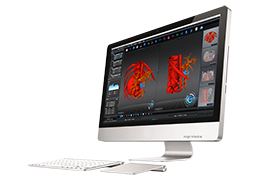
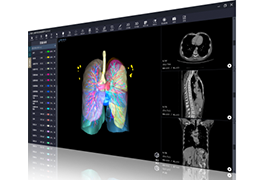
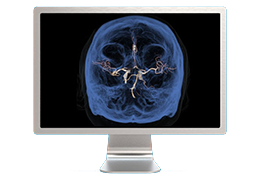
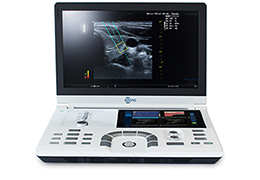
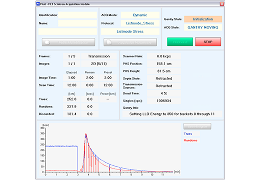
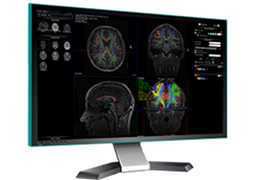
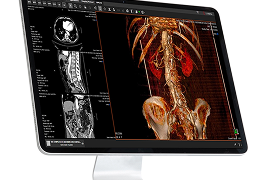
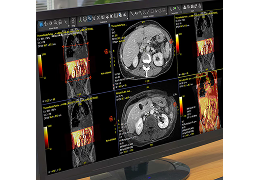
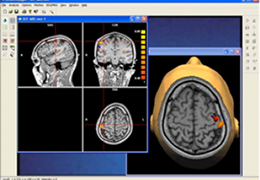
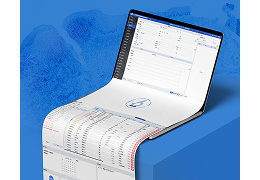
 Mirada XD™
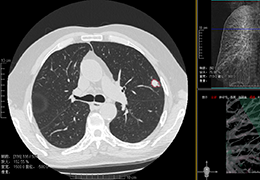
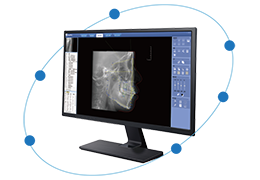
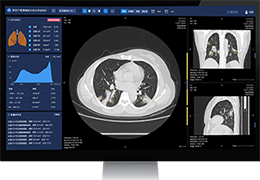
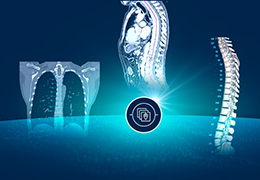
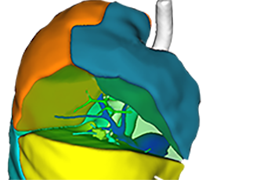
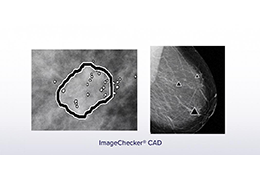
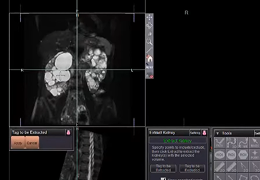
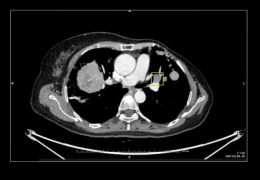
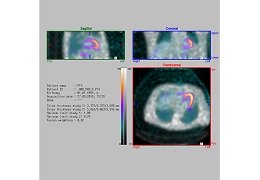
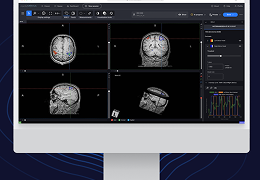
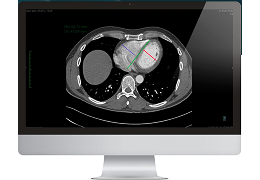
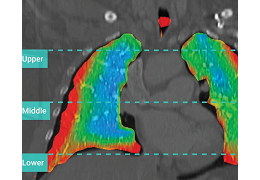
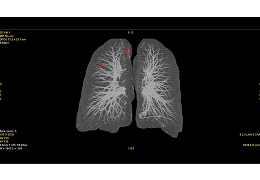
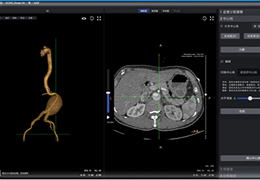
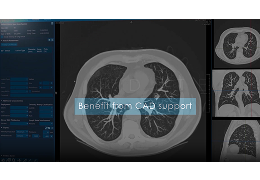
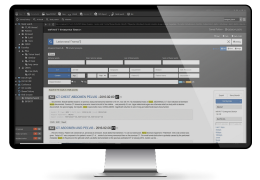
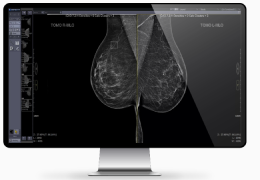
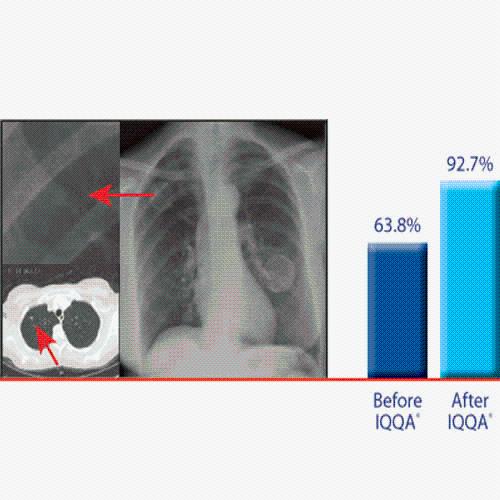 IQQA®-Chest
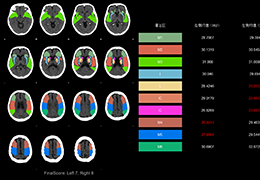
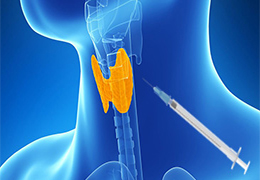
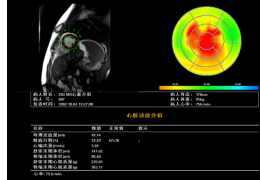
 甲状腺功能分析软件
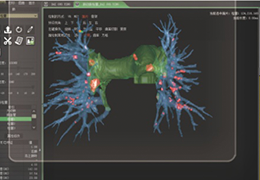
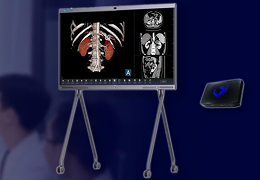
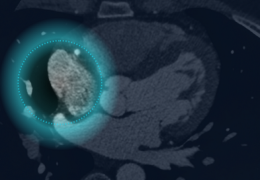
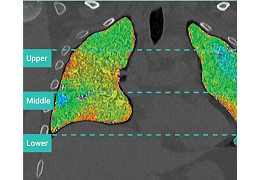
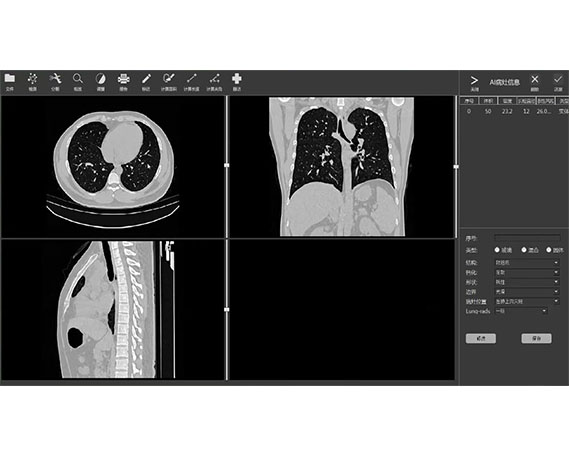 肺结节智能检测系统
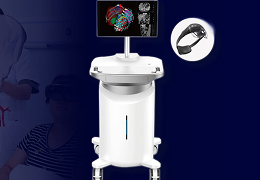
 D-CleverEye
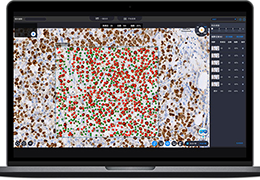
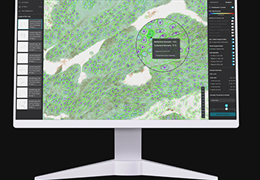
 D-PathAI
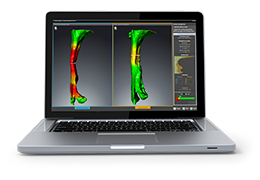
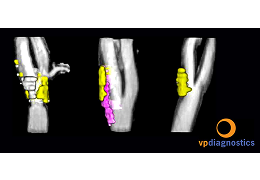
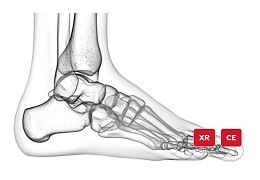
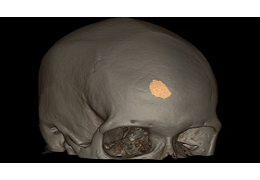
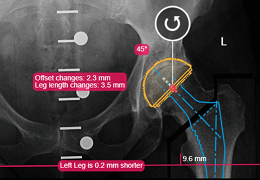
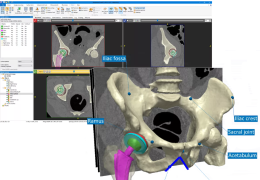
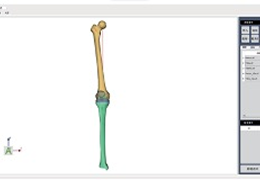
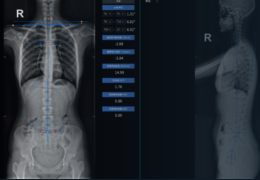
 骨科医学图像处理软件
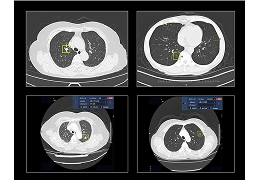
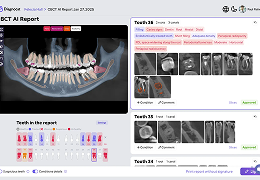
 肺癌辅助诊断系统
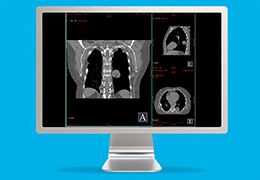
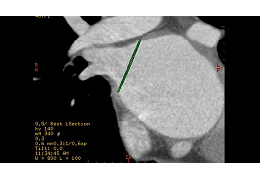
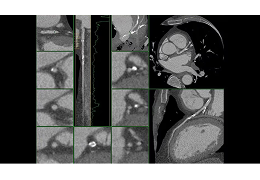
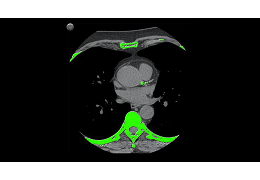
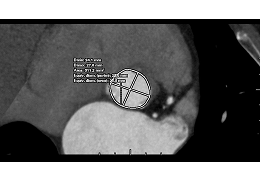
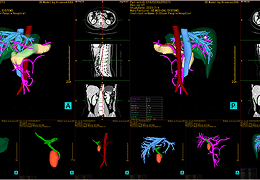
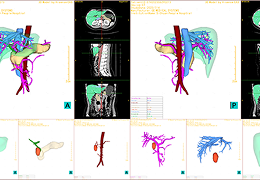
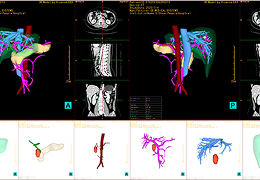
 肺动脉栓塞评估系统
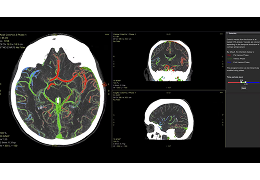
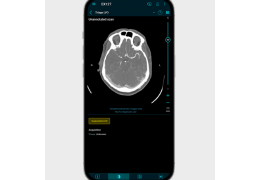
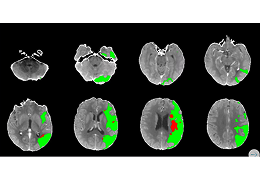
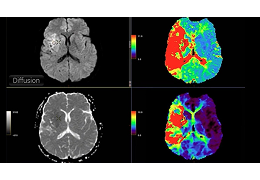
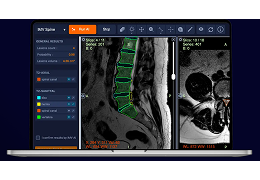
 F-STROKE全自动卒中影像处理系统
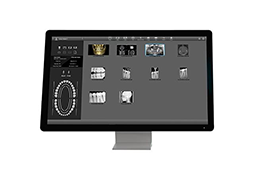
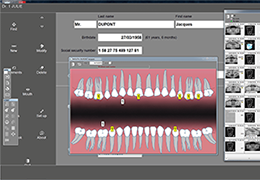
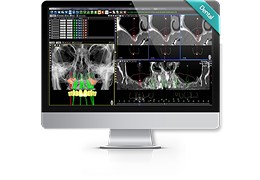
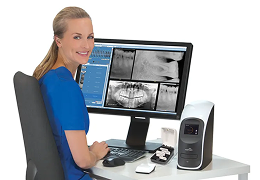
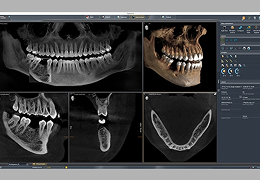
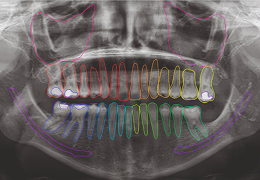
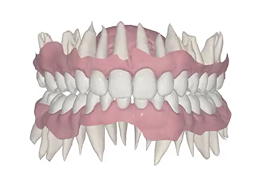
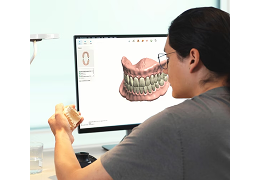
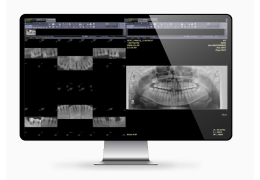
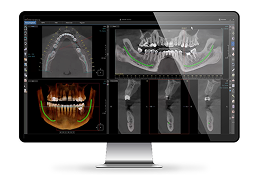
 SmartVPro 三维口腔医学影像处理软件
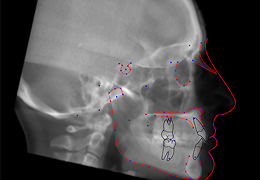
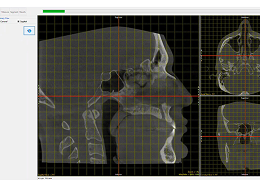
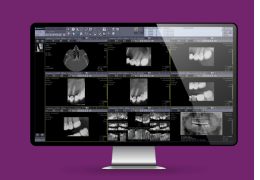
 CephPro3D 口腔图像处理软件
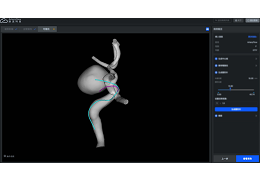
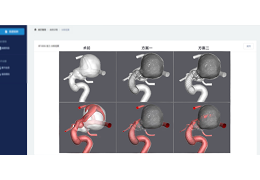
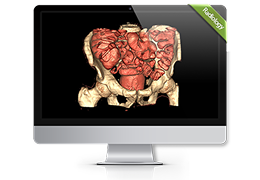
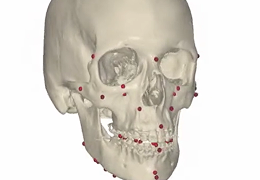
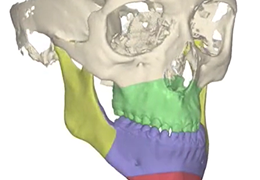
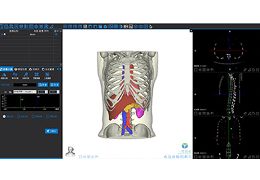
 3D精准手术规划分析系统
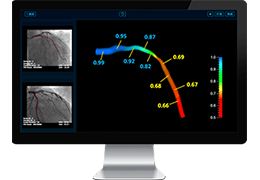
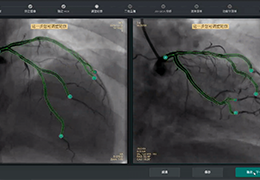
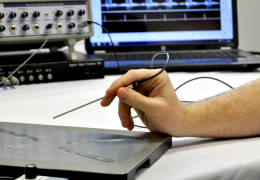
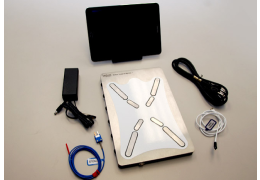
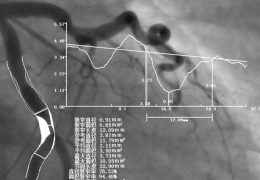
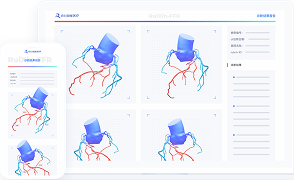
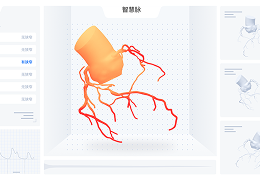
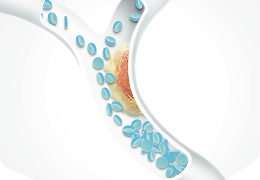
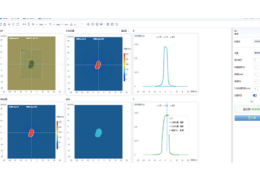
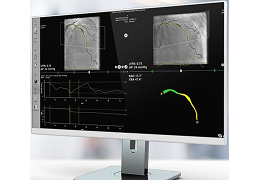
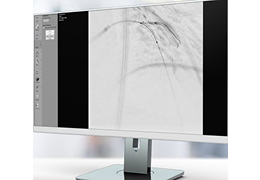
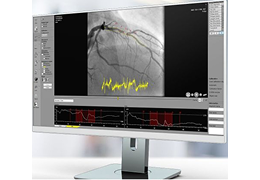
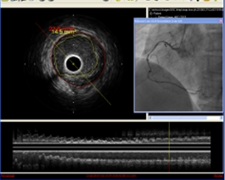
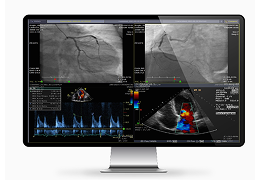
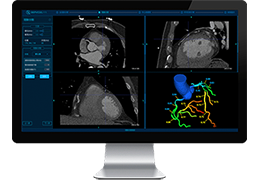 深脉分数(DV FFR)
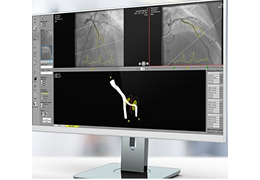
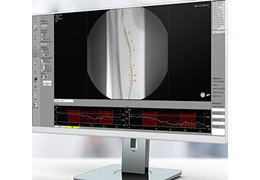
 深脉造影分数(DV ANGIO)
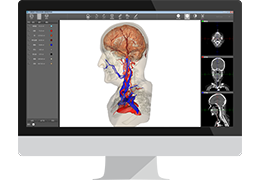
 TrueSight启元系统
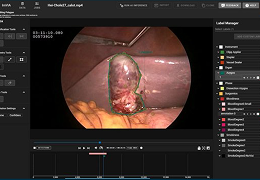
 深脉灵析肺部智能辅助诊断系统
 FastStroke
 Advantage 4D
 Autobone & VesselIQ Xpress
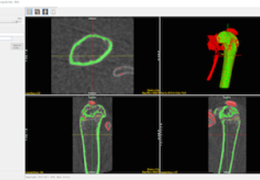
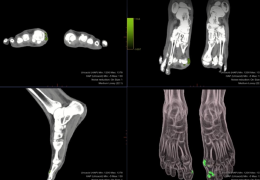
 Bone VCAR
 Dragonfly 3D World
 Vega
Vega
 asa erp
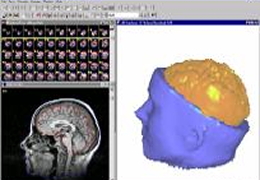
 BrainMagix
 FMD Studio
 Carotid Studio
 iQ-VIEW/PRO
 iQ-3D
iQ-3D
 SICAT Air
 ACTEON Imaging Suite ®
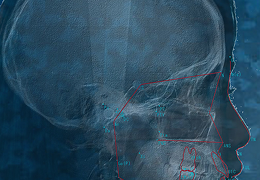
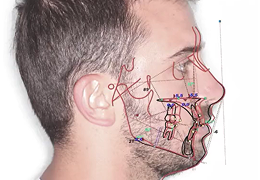
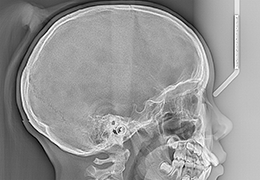 Cephalometric Analysis
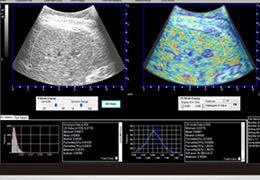
 AmCAD-UT ® Detection
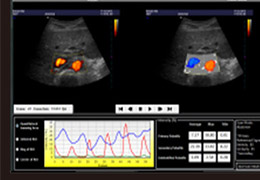
 AmCAD-CA
 AmCAD-US
 AmCAD-UV
 Quickvision
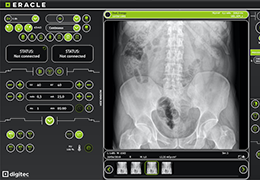 ERACLE
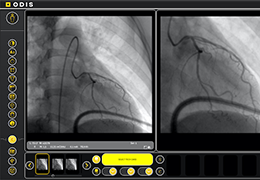 ODIS
ODIS
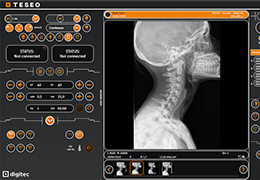 TESEO
TESEO
 Medical software AuroraCAD™
 BRAINANCE MD
 Zscan EVO
 eZGuide®
 EDM videocapture
 EDM CLASSIC SYSTEM
 Digitally Soft
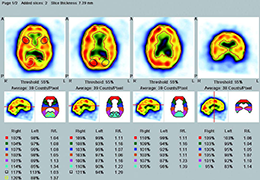
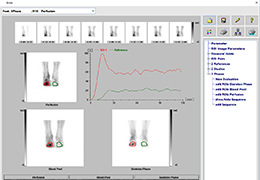 BONE – 3 PHASE SCINTIGRAPHY
 BONE – SPECT
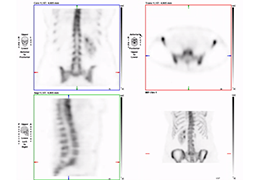
 BONE – WHOLE BODY SCAN
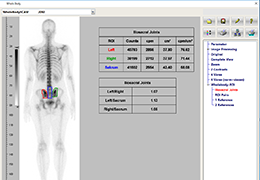
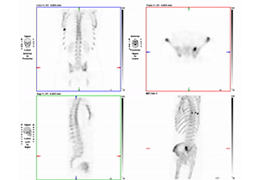 BONE – WHOLEBODY SPECT
 BRAIN PERFUSION
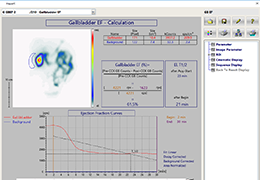 HeparX-program
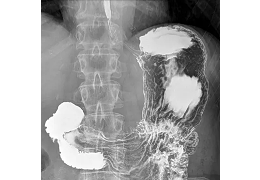
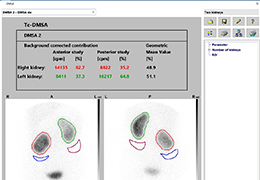 KIDNEY – DMSA SCINTIGRAPHY
 Nexus® DR
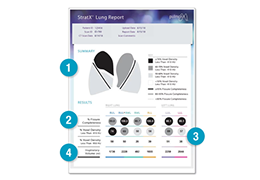
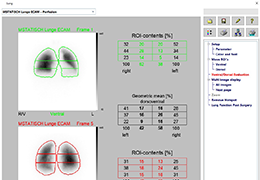 LUNG – QUANTIFICATION
 LUNG – SPECT
 Nexus® DRF
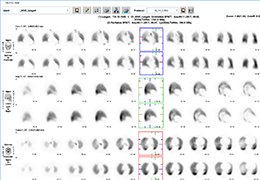
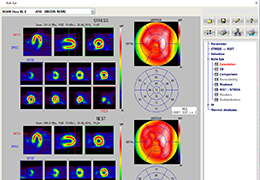 MYOCARD SPECT
 ECT – PROGRAM
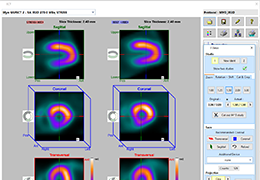
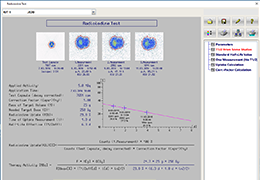 THYROID – RADIOIODINE TEST
 THYROID – SCINTIGRAPHY AND UPTAKE CALCULATION
 iSee®
iSee®
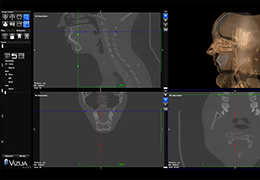 Vizua Online
 3D-DOCTOR
 SunCHECK Machine
 SunCHECK Patient
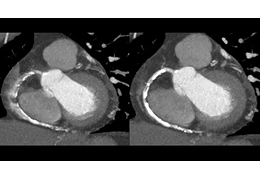
 3Di Cardiac CT
 3Di Cardiac MR
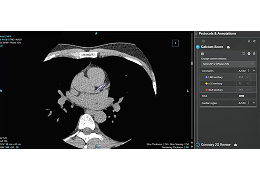
 3Di Calcium Score
 3Di Virtual Colonoscopy
 3Di Mammography Viewer
 3Di PET-CT Viewer
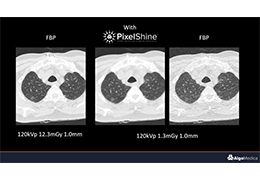 PixelShine
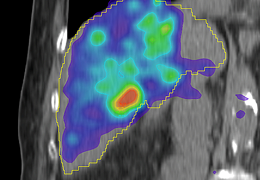
 PlanIQ
 ASSORT
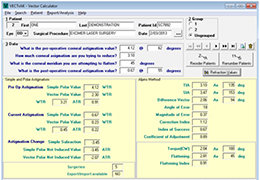 VECTrAK
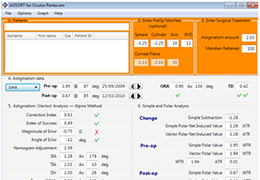 i-ASSORT
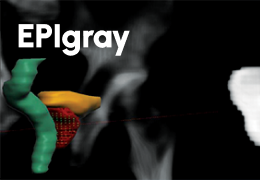 EPIgray®
 XoranConnect®
 IQQA®-3D胸肺系统
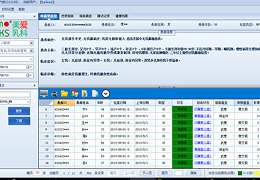
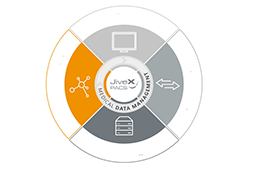 PACS
PACS
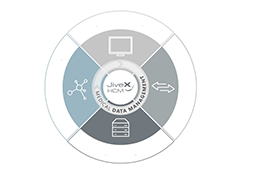 HCM
HCM
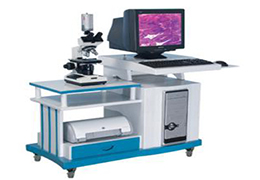
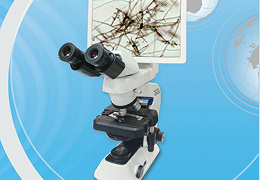
 BX-9100A精子质量分析系统
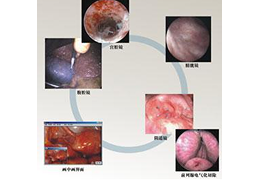
 BX-9100B性病图像分析系统
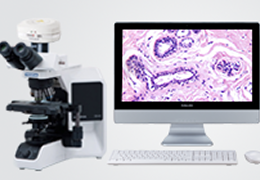
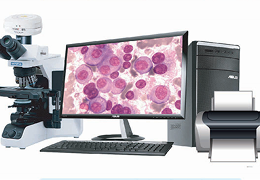
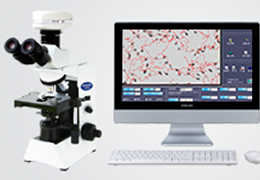
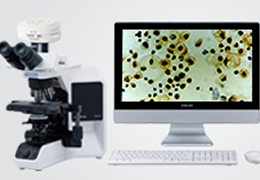
 BX-9100C细胞图像分析系统
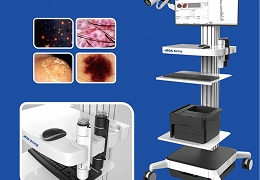
 BX-9100D病理图像分析系统
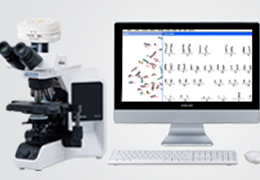
 BX-9100E染色体图像分析系统
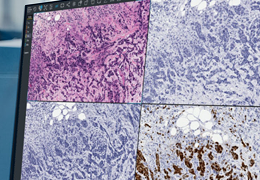
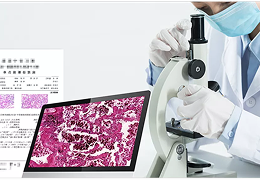
 创软病理分析系统
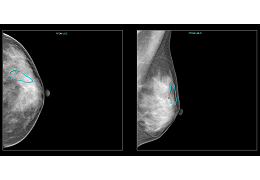
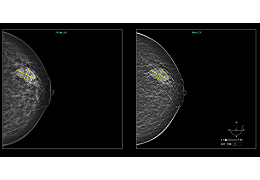
 Breast Image Analytics
 三维医学影像处理软件
 剪影 XAscope®
 Insight Vision Workstation
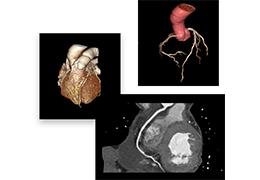
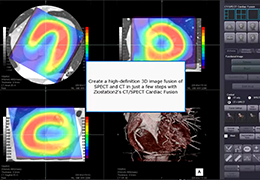 CT/SPECT CARDIAC FUSION
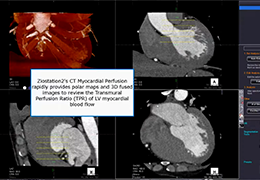 CT MYOCARDIAL PERFUSION
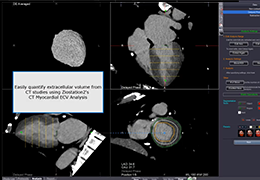 CT MYOCARDIAL ECV ANALYSIS
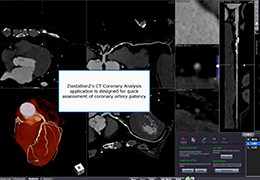 CT CORONARY ANALYSIS
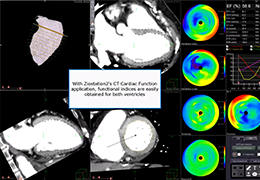 CT CARDIAC FUNCTION
 CT CALCIUM SCORING
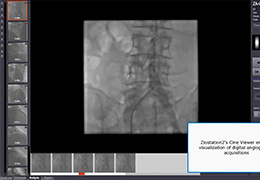 CINE VIEWER
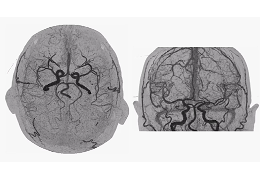
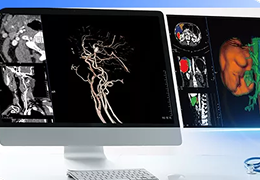
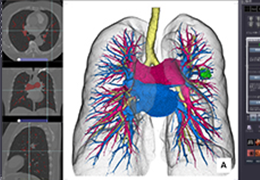 CT PA/PV AUTO-SEGMENTATION
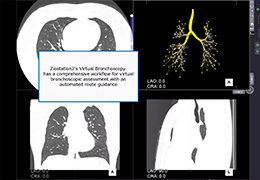 VIRTUAL BRONCHOSCOPY
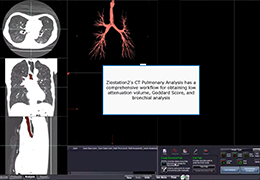 CT PULMONARY ANALYSIS
 FUSION VIEWER
 MULTI-MODALITY FUSION
 MR/MR FUSION
 MR COMBINATION
 CT DUAL KV
 4D TIC
 3D ANALYSIS
 CT RENAL STONE ANALYSIS
 CT LIVER ANALYSIS
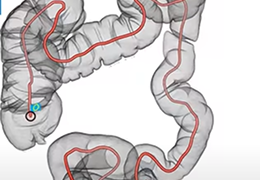 CT COLON ANALYSIS
 MR TX MAPPING
 ADVANCED MPR BATCH
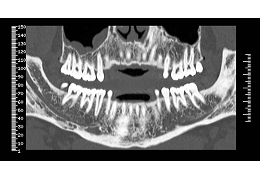
 CT DENTAL VIEWER
 MR MULTIPARAMETRIC ANALYSIS
 COMPUTED DWI
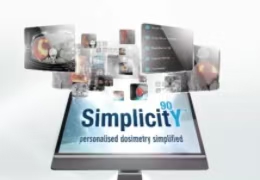 Simplicit90Y™
 iNTUITION
 Contour ProtégéAI+™
 MIM SurePlan™ MRT
 LesionID® Pro
 MIM SurePlan™ LiverY90
 MIM Symphony® Urology Ablation
 MIM Symphony Dx™
 MIM Symphony® HDR Fusion
 MIM Zero Footprint™
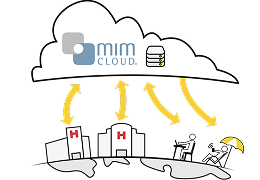 MIMcloud®
 Core Volume
 MIMneuro®
 MIMcardiac®
 UKnow®+UMate®颅内动脉瘤手术智能化解决方案
 UGuard®脑血管影像AI解决方案
 UAlpha®颅内血管智能模拟系统
 USearch优脑察
 ANYTHINK CT 智能影像平台
 CV-NET 心脏及血管介入学科工作平台系统
 Structural Heart 结构心影像分析平台
 Clinical Devices
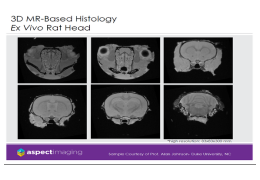
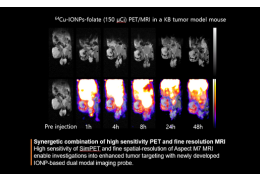
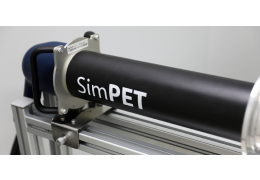 SimPET-Series
 AURORA
 M-Series
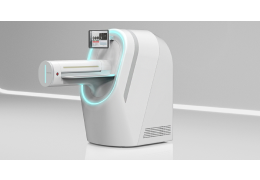
 M7-SimPET
 Doppler Flow Velocity System
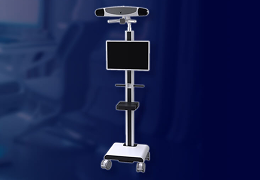
 Rodent Surgical Monitor
 INTERVENTION 介入影像后处理工作站平台
 ANYTHINK MR 智能影像平台
 ANYTHINK MM 多维云平台
 ANYTHINK NM 智能影像管理平台
 vpdiagnostics
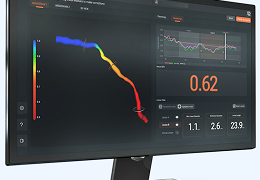
 RuiXin-FFR
 CoronaryAI
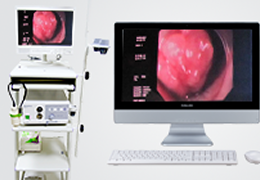
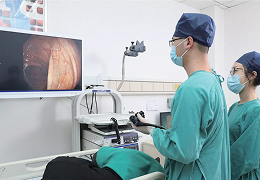 内镜·帧探
内镜·帧探
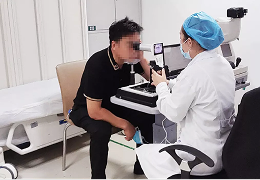 眼底慧探
眼底慧探
 Airdoc-AIFUNDUS
 青光眼检测SaMD
 白内障检测SaMD
 视觉训练SaMD
 智能眼科PACS系统
 眼科EMR系统
 眼科远程会诊平台
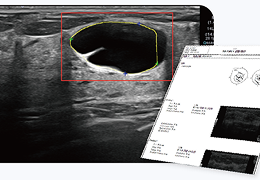
 甲状腺超声智能辅助诊断系统
 乳腺超声智能辅助诊断系统
 颈动脉超声智能辅助诊断系统
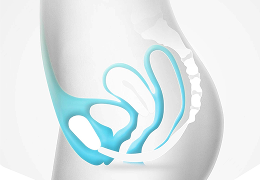 盆底超声智能辅助诊断系统
 3D精准手术规划和评估系统
 AmCAD-UT 安克侦®
 星航骨科手术导航系统
 阅片宝智能影像交互系统
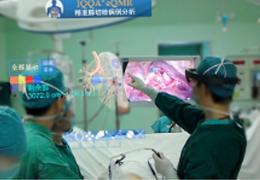
 星图混合现实全息影像系统
 FilmDose
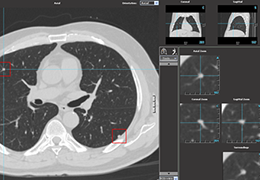
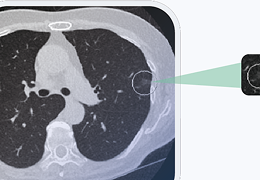
 CT肺结节智能筛查系统
 CT淋巴结智能分析系统
 FFDM乳腺智能分析系统
 DBT乳腺智能分析系统
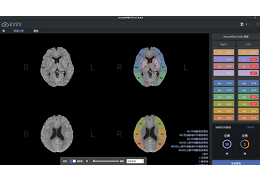
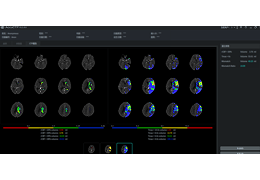
 脑核磁影像AI智能分析
 磁共振易损斑块AI智能分析
 冠脉CT AI智能分析
 е-CTP
е-CTP
 e-MRI
e-MRI
 Triage Stroke
 Triage LVO
 ILD
ILD
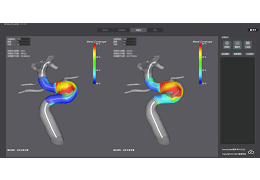
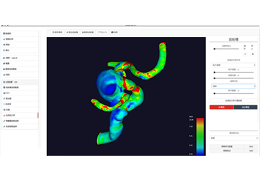 AneuFlow-颅内动脉瘤辅助诊断系统
 AneuGuide-颅内动脉瘤实时手术规划系统
 AneuShape-颅内动脉瘤微导管塑形产品
 AneuPlan-颅内动脉瘤手术方案规划系统
 AccuASPECTS-ASPECTS自动化评分系统
 AccuCTP-颅内CT灌注影像自动化分析系统
 AccuFFicas-颅内动脉狭窄一站式评估系统
 Planeca Romexis
 超声光散射乳腺诊断系统
 ART-Plan by TheraPanacea
 ImSimQA™
 SagiPlan® HDR & Focal Therapy Planning
 Echo:PrioTM
 CMR
CMR
 VOCT
VOCT
 CT1
CT1
 阿梵D
阿梵D
 Formus Altas
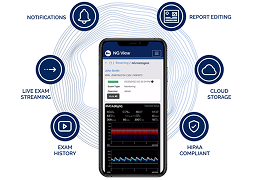 NG View
 Dental
 Radiology
 OEM Solutions
 RConsole1 : RoseM
 EConsole1 医用
 图像算法
图像算法
 病理质控与信息管理系统
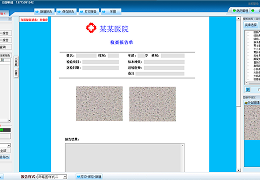
 皮肤真菌镜检病理图像分析系统
 皮肤镜(毛发)图像处理工作站
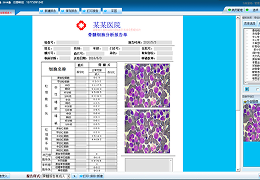
 骨髓细胞(体液)图像分析系统
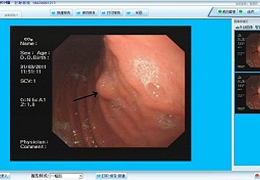
 内窥镜图像信息管理系统
 超声图像信息管理系统
 精子质量检测系统
 液基图像与信息管理系统
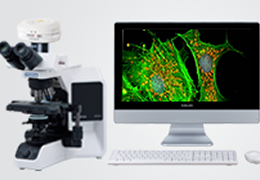 FISH荧光图像与分析系统
 染色体核型分析系统
 免疫组化分析系统
 手术图文影像处理系统
 超声图文影像处理系统
 放射图文影像处理系统
 病理图文影像处理系统
 数字云影像平台
 SECURED ARCHIVE SERVER FOR MEDICAL IMAGING
 MEDIP Pro
 MEDIP BOX
 DeepCatch X
 DCE-MRI: Body Tumor
 DCE-MRI: Prostate
 DWI & ADC
 NM Renogram Analysis
 Image Fusion
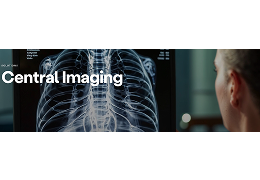 Central Imaging
 4DM
4DM
 BR-FHUS Smart System
 BR-Viewer
 BU-CAD™
 Ti-LUNG
 Medis QFR®
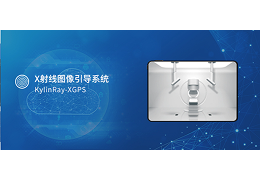 KylinRay-XGPS
 Medis Suite MR
 Medis Suite CT
 Medis Suite XA
 Medis Suite Ultrasound
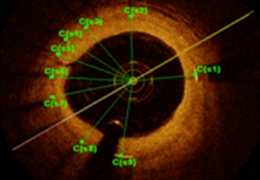
 Intravascular
 Sicat Endo
 VistaSoft and VistaCam
 KIDNEY – TER, GFR AND ERPF CALCULATION
 3D ACQUISITION
 MATCHING APPLICATION
 LIST-MODE
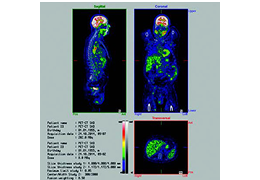 IMAGE FUSION
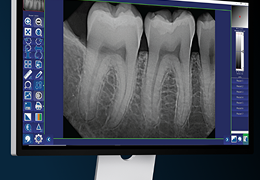 Dental Imaging Software
 Elios Zeus
 Nexus® VET
 IQ Software
 nordicBrainEx
 nordicMEDiVA
 Myrian
 CS Airway Module
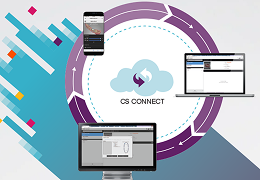 CS Connect
 3DISC Clinic
 Scan&Tell
 ENTERPRISE IMAGING
 DIGITAL PATHOLOGY
 ZEISS ATLAS 500 Multi-modality ocular surface analysis.
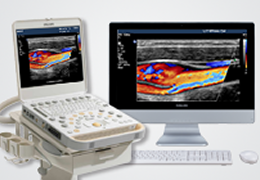
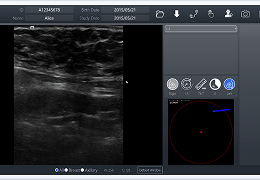
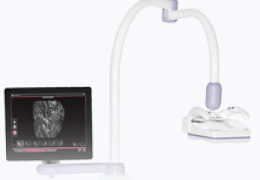
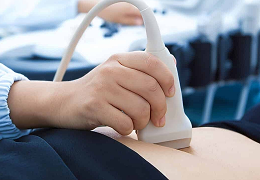 Ultrasound
 Examine Pro
 StratX® Report
 Cass vFFR
 Caas QCA
 ImViA
ImViA
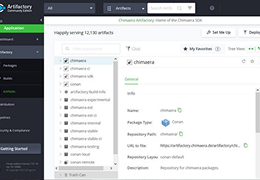 CHIMAERA SDK
 MEDICAL IMAGE REGISTRATION
 HiD 3D Reconstruction
 Caas QVA
 Caas LVA & RVA
 Caas IV-LINQ
 Caas StentEnhancer
 Caas QCA Research
 Caas QVA Research
 Trichoscale DX
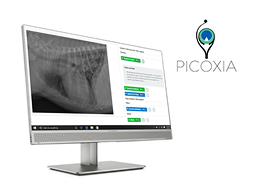 PICOXIA
 PASIscan®
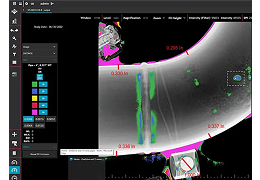
 3D CBCTto2D Ceph
 Magnetic Resonance Imaging
 Midmark IQmanager Software ®
 Midmark Imaging Software ®
 BESA Simulator
 Sidexis 4
 ONDEMAND3D
 ScopeReader J1
 ScopeReader Sumite
 Win Ceph
 WinCeph Web ver.2
 CAS MAS Ver .3
 DigiGnatho
 Sim Dentor Ver.1
 Analyze 15.0
 BMA: Bone Microarchitecture Analysis Add-On
 HNA: Head and Neck Analysis Add-On
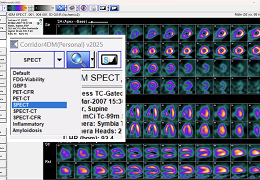 4DM
4DM
 NeoWise Software
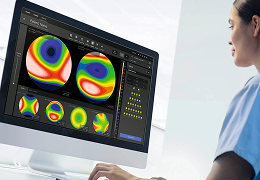
 Scolio3D
 echoPlaque
 Enhancer
 OrisDent
 Suitestensa Visit
 Subtle-ELITE™
 Suitestensa Cardio Surgery
 Suitestensa UniViewer
 Suitestensa Enterprise Viewer
 Suitestensa Screening
 SphereDx™
 IB Lab FROG
 Pulmonary Hypertension Assessment (PHA™)
 Airway Analysis
 Coronary Artery Calcification
 CT LVAS™
 XV LVAS®
 icobrain cva
 CardEP
 CardIQ Fusion
 CardIQ Suite
 DentaScan
 Dynamic Shuttle
 GSI Viewer
 Integrated Registration
 Lung VCAR
 MR VesselIQ™ Xpress
 NemoCeph
 READY View
 NemoCast
 SmartScore™ 4.0
 SnapShot Freeze 2
 NemoFAB Ortho
 Stroke VCAR
 TAVI Analysis
 NemoFAB
 NemoSmile
 Thoracic VCAR
 XR Studio™
 ConveyXR™
 CT-μFR(CT-QFR)
 OFR®
OFR®
 ValvePlus
 超声影像工作站
 液基细胞检测报告系统
 内窥镜影像工作站
 骨髓细胞图文报告系统
 X光影像工作站
 检验图文报告系统
 眼科手术显微镜录像系统
 前列腺液检验报告系统
 皮肤真菌检测报告系统
 模拟机数字化影像采集软件SimAcquire
 MammoWorks医学影像工作站
 3Shape Dental System
 Smart Vision 3DVWorks 医学图像处理软件
 医学影像处理软件
 三维医学影像云平台
 外科医学影像云平台
 全院PACS(三维+AI)
 口腔医学影像信息系统PACS
 病理影像管理与质控系统
 影像三维AI系统
 云胶片/电子胶片系统
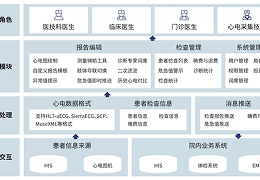 心电网络系统
 电生理网络系统
 II- M’Ath©
 Symmetry-Sync Software
 End-to-end orthopedic templating software
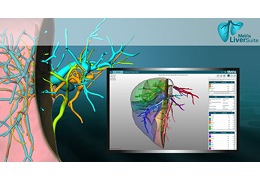 MeVis Liver Suite
 Simpleware Software
 Radiological Report
 3D Models
 IMV DICOM Viewer
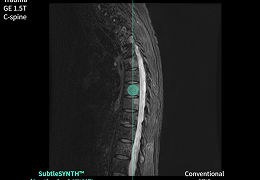 SubtleSYNTH™
 IMV AI Modules
 IQQA®-3D介入系统
 IQQA®-eQMR教学版
 IQQA®-eQMR临床版
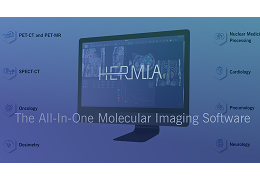 Hermia
 康复云平台
康复云平台
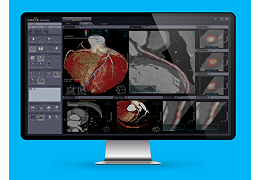
 深脉灵析:冠脉智能辅助诊断系统
 BrainVoyager QX
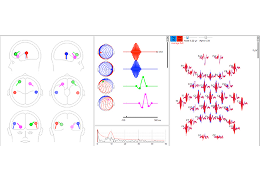
 BESA EEG/MEG Analysis
 adiologico IBIS
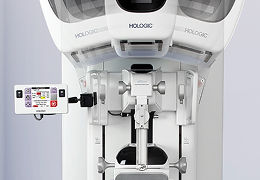
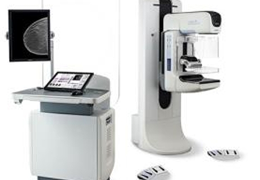
 3Dimensions™ Mammography System
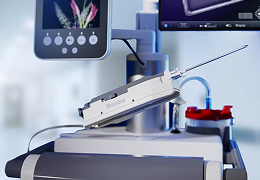
 Affirm® Breast Biopsy Guidance System
 Affirm® Contrast Biopsy Software
 Affirm® Prone Breast Biopsy System
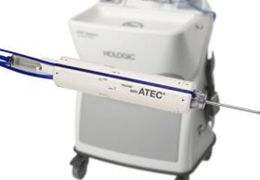 ATEC® Breast Biopsy System
 Brevera® Breast Biopsy System
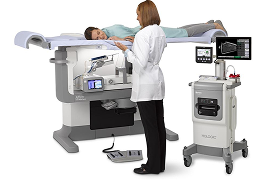
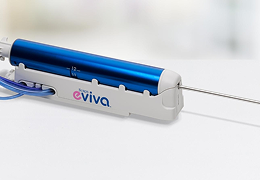 Eviva® Breast Biopsy System
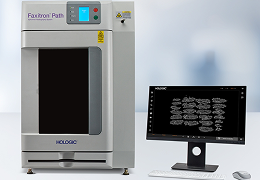 Faxitron® Path Specimen Radiography System
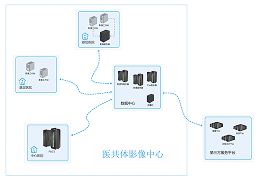 区域医学影像中心
 深脉十维:三维可视化处理软件
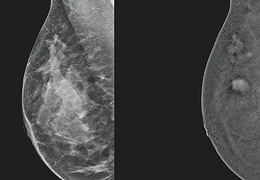 I-View® 2.0 Contrast-Enhanced Mammography Software
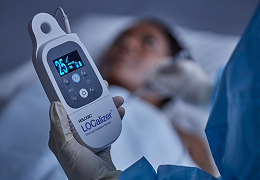 LOCalizer™ Wire-free Guidance System
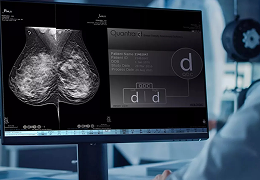 Quantra® 2.2 Breast Density Assessment Software
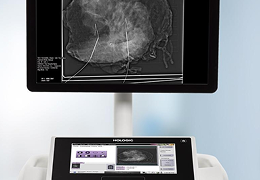
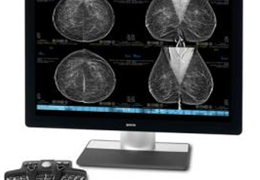 SecurView® Workstations
 信号/图像智能分析服务 人工智能疾病辅助分诊/诊断软件
 Remote Monitor Software 远程遥测分析软件
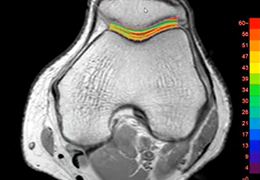
 Prophecy®/先知™ 膝关节图像处理软件
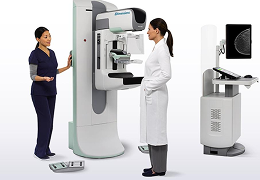
 MAMMOGRAPHY
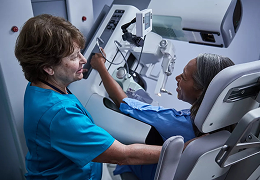
 Selenia® Dimensions® Mammography System
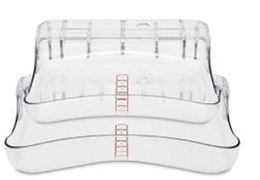 SmartCurve® Breast Stabilization System
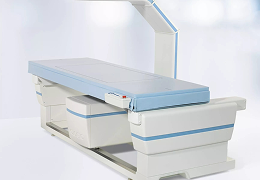
 Trident® HD Specimen Radiography System
 Horizon® DXA System
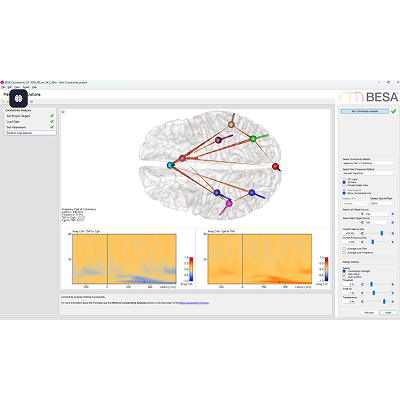
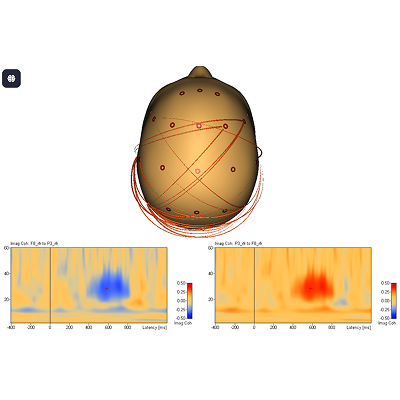
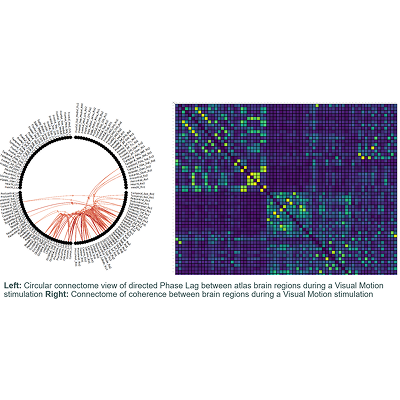
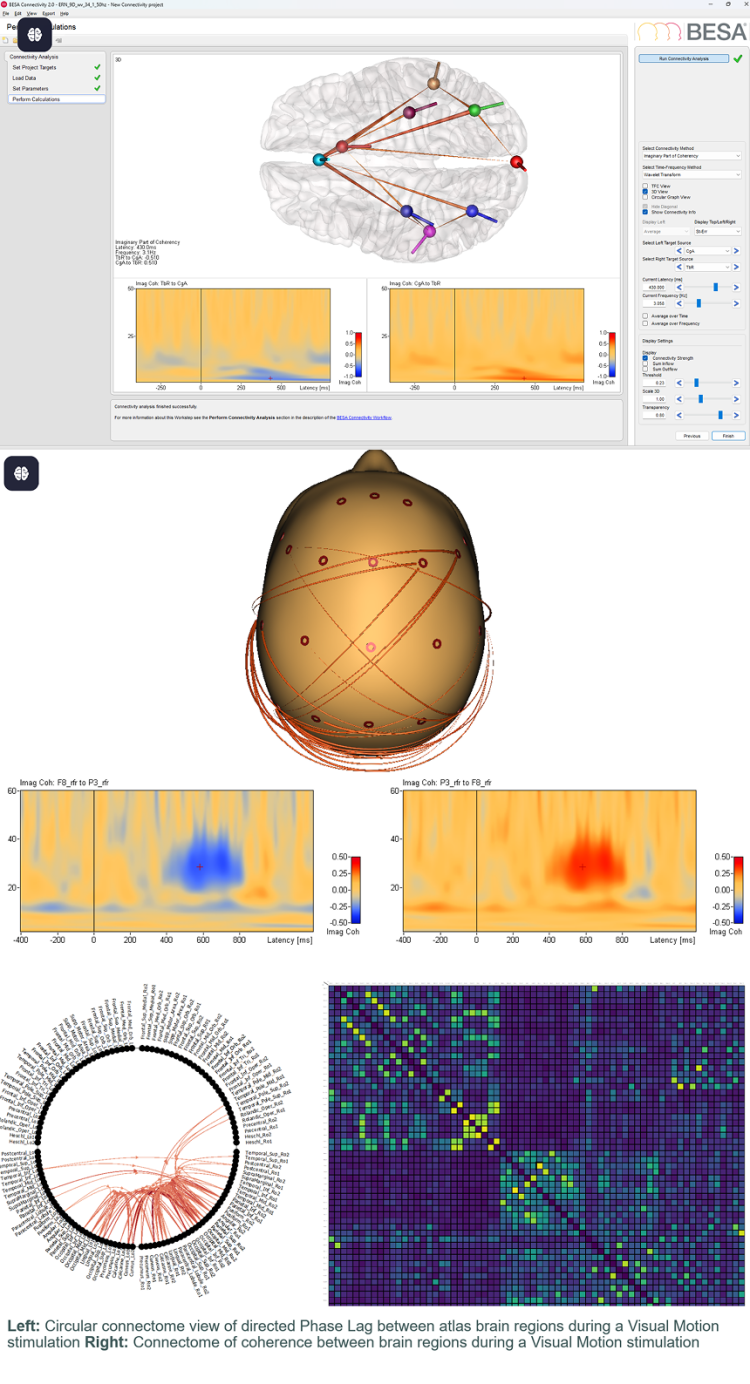
 BESA Connectivity
 ADSTRA Clinical™
 ADSTRA Imaging™
 病理流程管理系统
 Veolity
 DynaCAD 乳腺
 DynaCAD 前列腺
 Lunit SCOPE uIHC
 智能影像测量与初筛
 NFINITT Healthcare Platform (IHP)
 Enterprise Viewer
 INFINITT Multidisciplinary Team (MDT)
 INFINITT PACS
 INFINITT RIS
 INFINITT Mammo PACS
 INFINITT Cardiology Suite
 Xelis™ Cardiac
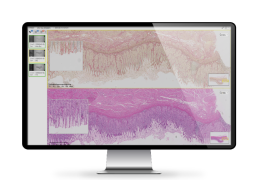 INFINITT Digital Pathology Solution
 INFINITT Versity Dental Platform
 INFINITT Dental PACS
 Xelis Dental
 INFINITT Ophthalmology PACS